Website Analytics Demystified: What Small Business Owners Actually Need to Track
Forget vanity metrics. Here are the website analytics that actually matter for small business growth—and how to use them to make smarter decisions.
Most small business owners I talk to fall into one of two camps: they either ignore their website analytics entirely, or they're drowning in data they don't understand. Neither approach helps your business grow.
After helping dozens of businesses make sense of their website data—and watching the "aha moments" when owners finally understand what their numbers mean—I've learned that analytics success isn't about tracking everything. It's about tracking the right things.
Here's your no-nonsense guide to the website metrics that actually matter.
Why Most Business Owners Get Analytics Wrong
The problem isn't a lack of data. Google Analytics alone tracks hundreds of metrics. The problem is knowing which ones deserve your attention.
Common mistakes I see:
- Obsessing over pageviews: High pageviews mean nothing if visitors aren't taking action
- Celebrating social media traffic: 1,000 visitors from Facebook who bounce immediately is worse than 100 visitors from Google who buy
- Ignoring mobile: Half your traffic is probably on phones—are they converting?
- Never checking analytics at all: Flying blind means missing opportunities and problems
Let's fix that.
The Only 5 Metrics Small Businesses Need to Track
I'm going to be deliberately prescriptive here. Yes, there are dozens of useful metrics. But if you're running a business and have limited time, focus on these five.
1. Conversion Rate
What it measures: The percentage of visitors who complete a desired action (buy, call, fill out a form, subscribe).
Why it matters: This is the metric that actually measures business impact. You could double your traffic and see zero revenue increase if your conversion rate drops.
What's good:
- E-commerce: 2-3% is average, 5%+ is excellent
- Lead generation: 3-5% is average, 10%+ is excellent
- Local service business: Form submission rates of 5-10% are solid
How to find it in Google Analytics 4: Navigate to Reports → Engagement → Conversions. You'll need to set up conversion events first (more on that below).
Red flags:
- Conversion rate suddenly drops (something broke)
- Mobile conversion rate is much lower than desktop (mobile experience issues)
- High traffic pages with zero conversions (wrong traffic or unclear calls-to-action)
2. Traffic Sources (Where Visitors Come From)
What it measures: How people find your website—search engines, social media, direct visits, referrals, or paid ads.
Why it matters: Understanding where your best customers come from helps you invest in the right channels. Not all traffic is equal.
What to look for:
- Organic Search: Free traffic from Google. Usually your highest-converting source for local businesses.
- Direct: People typing your URL or using bookmarks. Often repeat customers.
- Referral: Traffic from other websites linking to you. Quality varies wildly.
- Social: Facebook, Instagram, LinkedIn, etc. Often high volume, lower conversion.
- Paid Search: Google Ads traffic. Should convert well if campaigns are optimized.
How to analyze: Don't just look at volume. Compare conversion rates by source. If social media brings 50% of your traffic but only 5% of your conversions, that's important to know.
Red flags:
- Over-reliance on one source (risky if it changes)
- Paid traffic that doesn't convert (wasting money)
- No organic search traffic (SEO problems)
3. Top Landing Pages
What it measures: Which pages visitors see first when they arrive at your site.
Why it matters: Your landing pages are your first impression. If they're not working, nothing else matters.
What to track:
- Which pages attract the most traffic
- Bounce rate for each landing page
- Conversion rate by landing page
How to find it in GA4: Reports → Engagement → Landing pages
What good looks like:
- Homepage shouldn't be your only landing page (means your other content isn't being found)
- Service/product pages should have lower bounce rates than blog posts
- High-traffic landing pages should have clear calls-to-action
Red flags:
- 404 error pages appearing as top landing pages (broken links)
- High-traffic pages with 80%+ bounce rates (content mismatch or slow loading)
- Blog posts ranking but no conversion path
4. Mobile vs. Desktop Performance
What it measures: How your site performs for visitors on phones vs. computers.
Why it matters: For most small businesses, 50-70% of traffic now comes from mobile devices. If your mobile experience is poor, you're losing half your potential customers.
Key comparisons:
- Bounce rate: Mobile vs. Desktop
- Conversion rate: Mobile vs. Desktop
- Average session duration: Mobile vs. Desktop
How to find it in GA4: Reports → Tech → Tech details → Filter by device category
What to look for: If your mobile conversion rate is less than half of your desktop rate, your mobile experience needs work. Common issues:
- Slow loading (mobile users are impatient)
- Buttons too small to tap
- Forms that are hard to fill out on phones
- Pop-ups that are difficult to close
5. Site Speed
What it measures: How fast your pages load.
Why it matters: Every second of load time costs you conversions. Amazon found that every 100ms of latency cost them 1% in sales. You're not Amazon, but the principle holds.
Target benchmarks:
- Under 3 seconds: Good
- 3-5 seconds: Acceptable but improvable
- Over 5 seconds: Actively hurting your business
How to check:
- Google PageSpeed Insights (free): pagespeed.web.dev
- GA4: Reports → User → Tech details → Look at pages with high exit rates
Quick wins for speed:
- Compress images (biggest impact)
- Enable browser caching
- Use a content delivery network (CDN)
- Minimize plugins and scripts
Setting Up What Matters: A 30-Minute Analytics Setup
If you haven't set up proper tracking, here's how to do it in about 30 minutes.
Step 1: Verify Google Analytics 4 is Installed
Check that GA4 is on every page of your site. If you're using WordPress, plugins like MonsterInsights or Site Kit make this easy. For other platforms, you'll add a code snippet to your site header.
Step 2: Set Up Conversion Events
This is the step most businesses skip—and it's the most important. Tell Google Analytics what counts as a success for your business.
Common conversions to track:
- Form submissions (contact, quote request, newsletter)
- Phone number clicks
- Purchase completions
- Chat widget engagements
- PDF downloads
- Video plays (for important content)
In GA4, go to Configure → Events, then mark relevant events as conversions.
Step 3: Connect Google Search Console
This free tool shows you exactly what search queries bring people to your site. It's invaluable for understanding your SEO performance.
Link it to GA4: Admin → Property → Product links → Search Console links
Step 4: Create a Simple Dashboard
Don't log into analytics and stare at the default reports. Create a simple dashboard showing your 5 key metrics. Check it weekly—any more often and you'll overreact to normal fluctuations.
Making Decisions from Data
Collecting data is pointless if you don't act on it. Here's how to turn insights into improvements.
Weekly Quick Check (5 minutes)
Every week, answer these questions:
- Did anything break? (Sudden traffic drops, spike in 404 errors)
- Are conversions trending up or down?
- Any unusual spikes worth investigating?
Monthly Deep Dive (30 minutes)
Once a month, dig deeper:
- Which traffic sources are performing best/worst?
- Which landing pages need improvement?
- How does mobile compare to desktop?
- Are there pages with high traffic but low conversions?
Quarterly Strategic Review (1-2 hours)
Every quarter, step back and ask:
- What marketing channels should we invest more/less in?
- What content is actually driving business?
- Are we reaching the right audience?
- What's our biggest opportunity for improvement?
What the Numbers Can't Tell You
Analytics are powerful, but they have limits. Numbers tell you what is happening, not why.
You'll still need to:
- Talk to customers about their experience
- Test different approaches to see what improves results
- Consider factors analytics can't measure (brand reputation, word of mouth)
- Use common sense when data seems off
A 90% bounce rate on your blog might be fine—people read the article and got what they needed. A 90% bounce rate on your services page is a problem. Context matters.
Common Questions
How often should I check my analytics?
Weekly for the quick check, monthly for deeper analysis. Checking daily leads to overreacting to normal variation.
What's a "good" bounce rate?
It depends entirely on the page type. Blog posts: 70-90% is normal. Homepage: 40-60% is typical. Product/service pages: under 50% is good.
Should I worry about sessions vs. users vs. pageviews?
Not really. Focus on conversions and the metrics that influence them. The distinctions between sessions and users matter more for very high-traffic sites.
Is Google Analytics free?
Yes, GA4 is free and sufficient for virtually all small businesses. The paid version (GA360) is for enterprises with millions of monthly visitors.
What if my numbers are bad?
That's actually good news—you've identified an opportunity. Bad numbers you know about are better than problems you're ignoring.
Getting Help
If analytics still feels overwhelming, that's okay. Sometimes the best investment is getting a professional to set up proper tracking and create a dashboard you can actually use.
I regularly help businesses:
- Set up Google Analytics 4 correctly
- Create conversion tracking for forms and calls
- Build custom dashboards showing metrics that matter
- Interpret data and recommend improvements
The goal isn't to become an analytics expert—it's to understand enough to make better business decisions.
The Bottom Line
Website analytics don't have to be complicated. Focus on these five metrics:
- Conversion rate - Are visitors becoming customers?
- Traffic sources - Where do your best customers come from?
- Top landing pages - Are first impressions working?
- Mobile performance - Is half your audience being ignored?
- Site speed - Are slow pages costing you business?
Check them regularly, act on what you learn, and you'll be ahead of 90% of small businesses who either ignore their data or drown in it.
The best time to start was when you launched your site. The second best time is today.
Tags

About Kevin Wolff
Kevin is a web developer and digital strategist based in Ocean City, MD. He specializes in creating modern websites, SharePoint solutions, and digital marketing strategies that help businesses grow online.
Free: AI Readiness Checklist
Subscribe and instantly download our 15-question checklist to discover where AI automation can save you time and grow your business.
Related Articles
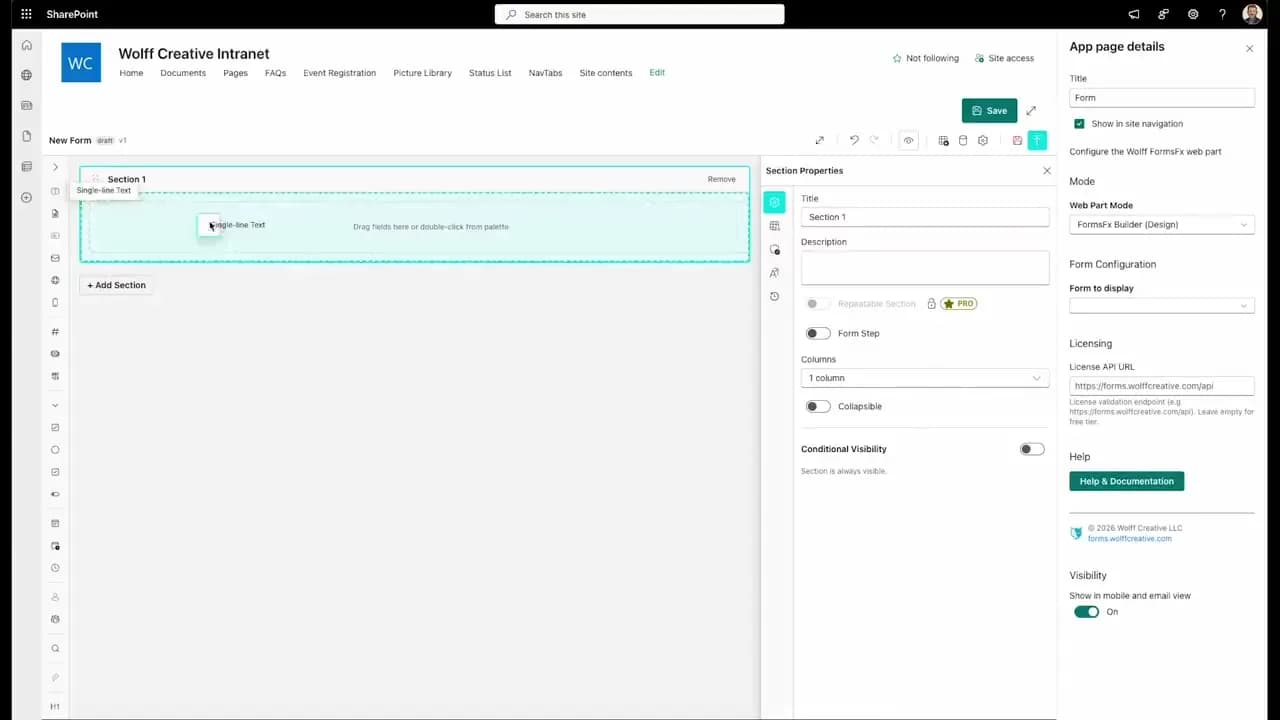
FormsFx: A Drag-and-Drop SharePoint Form Builder with Rules, Formulas, and Cascading Dropdowns
We built a SharePoint form builder that does what InfoPath did — conditional logic, calculated fields, cascading dropdowns — but runs natively as an SPFx web part. Here's how it works under the hood.
Read More →
FormsFx Has a Built-In Submissions Dashboard — Here's Why That Matters
Most SharePoint form builders stop at form submission. FormsFx includes a full dashboard for managing, searching, filtering, exporting, and approving submissions — no Power BI or custom views required.
Read More →
Offline Forms, Webhook Signatures, and Enterprise Connectors — FormsFx Beyond SharePoint Lists
FormsFx doesn't just write to SharePoint lists. It supports offline submission queuing, HMAC-signed webhooks for Power Automate, and enterprise connectors for SQL Server, Dataverse, REST APIs, and Azure Service Bus.
Read More →Need Help With This?
I help Eastern Shore businesses with web development, marketing, and AI automation. Let's talk about your project.
Need Help With Your Project?
Ready to take your business to the next level? Let's discuss how I can help.